Politically extreme sources publish more COVID-19 news than scientifically-groun
Source: Brandi Wampler
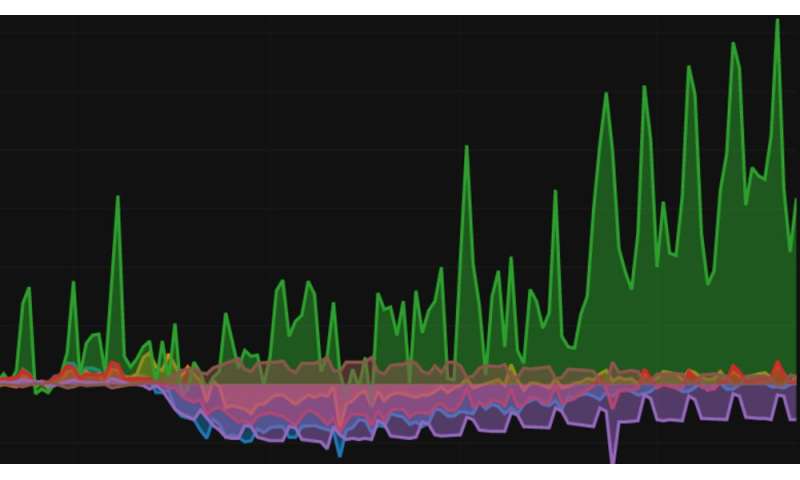 In an initial study conducted at the University of Notre Dame, researchers found that least-biased news sources and scientific-based news sources published less than a quarter of all stories currently available about COVID-19. Sources evaluated as right-leaning, left-leaning or less factual (those that cite questionable sources or share conspiratorial-pseudoscientific information) account for more than 75 percent of all COVID-19 related news stories. Additionally, news articles about COVID-19 have steadily decreased since the World Health Organization (WHO) declared the pandemic in March, regardless of coronavirus-related cases, deaths and policy changes.
Nitesh Chawla, lead on this study, and his team developed the pandemic pulse tool, which provides state-by-state information on a variety of coronavirus-related topics including demographics, cases, social distancing, search trends and news articles organized by news source bias and occurrence. According to Chawla, these insights provide a perspective on how narratives are developing, how society is reacting and how well measures are working.
"Given the societal implications of COVID-19, it is as important to capture the social response to the pandemic as much as the scientific pulse and understanding of the coronavirus," said Chawla, the Frank M. Freimann Professor of Computer Science and Engineering and the founding director of the Lucy Family Institute for Data and Society at Notre Dame. "By monitoring social and behavioral trends, our research team aims to capture a holistic picture of the pandemic's effects on people throughout the U.S."
Media outlets began reporting on the coronavirus in the beginning of January, shortly after China publicly identified the novel virus. At the end of January, after the WHO declared a public health emergency, news coverage temporarily spiked before declining through most of February. A similar but much larger spike occurred after the WHO's declaration of a global pandemic March 11, followed by a similar decline.
Overall, the study shows that although the coronavirus cases have fluctuated and even decreased, the number of news articles published on the pandemic have decreased at a faster rate than the number of COVID-19 cases. By evaluating spikes in media coverage, the researchers found that media outlets were more interested in novel events at the beginning of the pandemic.
Chawla and his team utilized the Global Database of Events, Language, and Tone—a platform that monitors print, broadcast and online news worldwide—to identify COVID-19 news articles. They then used the platforms Media Bias/Fact Checking and AllSlides to quantify media bias in those news articles. The study applied eight different ratings to classify bias for nearly two million news articles with categories including left, left-center, right, right-center, least biased, scientific, questionable sources and conspiracy-pseudoscience.
When comparing COVID-19 news articles and the representation of the different bias ratings of news published pre-pandemic, the study showed that scientific and least-biased-rated news has been represented less since the pandemic began. However, the representation of left-, right-center-, right- and conspiracy-pseudoscience-rated news articles have increased since the pandemic.
"Beyond analyzing news bias in regards to the pandemic, we have been able to analyze the data on a number of trends and have them available in the pandemic pulse dashboard, which could help people better understand how behaviors vary state to state and how they could impact the spread of coronavirus in the coming weeks," said Chawla.
The pandemic pulse dashboard provides state by state breakdowns and allows users to adjust charts by date and various indicators. In addition to showing news bias by state, the dashboard includes location histories collected by Google to map locations people have been visiting—like grocery stores, parks and retail locations—which are heavily impacted by state social distancing and lockdown requirements.
On many state graphs, retail and recreation locations trends dropped significantly between March and April, indicating the beginning of many lockdowns across the country. Researchers were also able to use cellular devices to track changes in distances traveled by state, which increased as lockdowns began to ease.
"Each state was different in their lockdown or social distancing measure restrictions in regards to severity and timing, which means the data will give us several perspectives to assess how those different restrictions and changes could correlate to the trend in COVID-19 cases, all in one platform," Chawla said.
| }
|